Clean No Call and Only Heterozygous Markers Module
The usage of the standalone module is shown below:
$ pyGenClean_clean_noCall_hetero_snps --help
usage: pyGenClean_clean_noCall_hetero_snps [-h] [-v] --tfile FILE [--out FILE]

Removes "no calls" only and heterozygous only markers.

optional arguments:
  -h, --help     show this help message and exit
  -v, --version  show program's version number and exit

Input File:
  --tfile FILE   The input file prefix (will find the tped and tfam file by
                 appending the prefix to .tped and .tfam, respectively.

Output File:
  --out FILE     The prefix of the output files. [default:
                 clean_noCall_hetero]
Input Files
This module uses the transposed pedfile format separated by tabulations
(tped and tfam files) for the source data set (the data of interest).
Procedure
Here are the steps performed by the module:
- Reads the transposed pedfiles and extract markers which are all heterozygous or all failed from the dataset.
Output Files
The output files of each of the steps described above are as follow (note that
the output prefix shown is the one by default [i.e.
clean_noCall_hetero_snps]):
- One transposed pedfiles and two custom output files are created:
clean_noCall_hetero: the transposed pedfiles separated by tabulations containing the new dataset, with markers which are all heterozygous or all failed were removed from the initial dataset.clean_noCall_hetero.allHetero: the list of markers which were all heterozygous in the initial dataset.clean_noCall_hetero.allFailed: the list of markers which were all failed in the initial dataset.
The Plots
A standalone script has been created so that heterozygosity rates can be visualized using histograms or box plots. This script has not yet been included in the automated pipeline, so it needs to be started manually.
$ pyGenClean_heterozygosity_plot --help
usage: pyGenClean_heterozygosity_plot [-h] [-v] --tfile FILE [--boxplot]
                                      [--format FORMAT] [--bins INT]
                                      [--xlim FLOAT FLOAT] [--ymax FLOAT]
                                      [--out FILE]

Plots the distribution of the heterozygosity ratio.

optional arguments:
  -h, --help          show this help message and exit
  -v, --version       show program's version number and exit

Input File:
  --tfile FILE        The prefix of the transposed file

Options:
  --boxplot           Draw a boxplot instead of a histogram.
  --format FORMAT     The output file format (png, ps, pdf, or X11 formats are
                      available). [default: png]
  --bins INT          The number of bins for the histogram. [default: 100]
  --xlim FLOAT FLOAT  The limit of the x axis (floats).
  --ymax FLOAT        The maximal Y value.

Output File:
  --out FILE          The prefix of the output files. [default:
                      heterozygosity]
The script produces either a histogram (see the Heterozygosity rate histogram figure) or a box plot (see the Heterozygosity rate box plot figure) of samples’ heterozygosity rates.
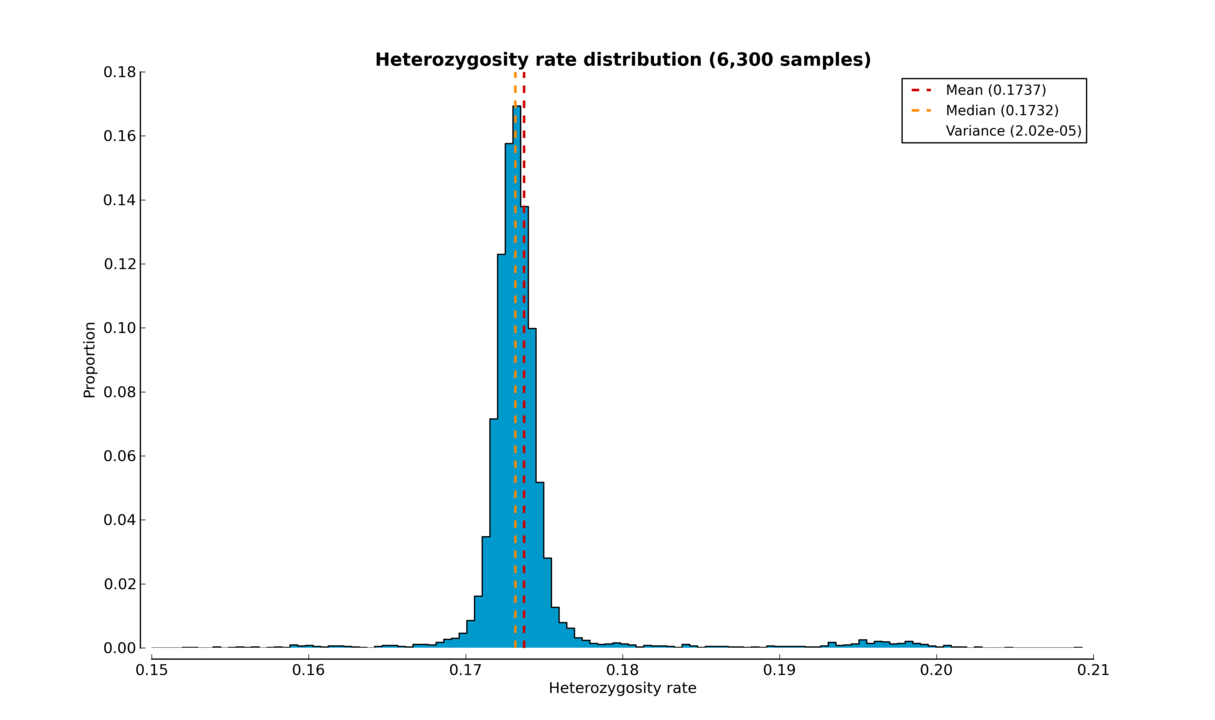
Heterozygosity rate histogram
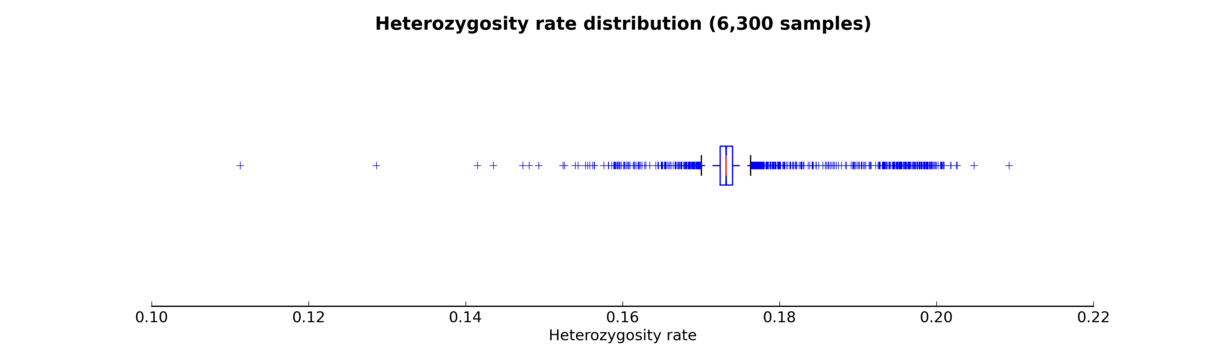
Heterozygosity rate box plot
The Algorithm
For more information about the actual algorithms and source codes, refer to the following pages.