Ethnicity Module
The usage of the standalone module is shown below:
$ pyGenClean_check_ethnicity --help
usage: pyGenClean_check_ethnicity [-h] [-v] --bfile FILE [--skip-ref-pops]
                                  [--ceu-bfile FILE] [--yri-bfile FILE]
                                  [--jpt-chb-bfile FILE] [--min-nb-snp INT]
                                  [--indep-pairwise STR STR STR] [--maf FLOAT]
                                  [--sge] [--sge-walltime TIME]
                                  [--sge-nodes INT INT]
                                  [--ibs-sge-walltime TIME]
                                  [--ibs-sge-nodes INT INT]
                                  [--line-per-file-for-sge INT]
                                  [--nb-components INT] [--outliers-of POP]
                                  [--multiplier FLOAT] [--xaxis COMPONENT]
                                  [--yaxis COMPONENT] [--format FORMAT]
                                  [--title STRING] [--xlabel STRING]
                                  [--ylabel STRING] [--create-scree-plot]
                                  [--scree-plot-title TITLE] [--out FILE]

Checks samples' ethnicity using reference populations and IBS.

optional arguments:
  -h, --help            show this help message and exit
  -v, --version         show program's version number and exit

Input File:
  --bfile FILE          The input file prefix (will find the plink binary
                        files by appending the prefix to the .bim, .bed and
                        .fam files, respectively.
  --skip-ref-pops       Perform the MDS computation, but skip the three
                        reference panels.
  --ceu-bfile FILE      The input file prefix (will find the plink binary
                        files by appending the prefix to the .bim, .bed and
                        .fam files, respectively.) for the CEU population
  --yri-bfile FILE      The input file prefix (will find the plink binary
                        files by appending the prefix to the .bim, .bed and
                        .fam files, respectively.) for the YRI population
  --jpt-chb-bfile FILE  The input file prefix (will find the plink binary
                        files by appending the prefix to the .bim, .bed and
                        .fam files, respectively.) for the JPT-CHB population

Options:
  --min-nb-snp INT      The minimum number of markers needed to compute IBS
                        values. [Default: 8000]
  --indep-pairwise STR STR STR
                        Three numbers: window size, window shift and the r2
                        threshold. [default: ['50', '5', '0.1']]
  --maf FLOAT           Restrict to SNPs with MAF >= threshold. [default:
                        0.05]
  --sge                 Use SGE for parallelization.
  --sge-walltime TIME   The walltime for the job to run on the cluster. Do not
                        use if you are not required to specify a walltime for
                        your jobs on your cluster (e.g. 'qsub
                        -lwalltime=1:0:0' on the cluster).
  --sge-nodes INT INT   The number of nodes and the number of processor per
                        nodes to use (e.g. 'qsub -lnodes=X:ppn=Y' on the
                        cluster, where X is the number of nodes and Y is the
                        number of processor to use. Do not use if you are not
                        required to specify the number of nodes for your jobs
                        on the cluster.
  --ibs-sge-walltime TIME
                        The walltime for the IBS jobs to run on the cluster.
                        Do not use if you are not required to specify a
                        walltime for your jobs on your cluster (e.g. 'qsub
                        -lwalltime=1:0:0' on the cluster).
  --ibs-sge-nodes INT INT
                        The number of nodes and the number of processor per
                        nodes to use for the IBS jobs (e.g. 'qsub
                        -lnodes=X:ppn=Y' on the cluster, where X is the number
                        of nodes and Y is the number of processor to use. Do
                        not use if you are not required to specify the number
                        of nodes for your jobs on the cluster.
  --line-per-file-for-sge INT
                        The number of line per file for SGE task array for the
                        IBS jobs. [default: 100]
  --nb-components INT   The number of component to compute. [default: 10]

Outlier Options:
  --outliers-of POP     Finds the outliers of this population. [default: CEU]
  --multiplier FLOAT    To find the outliers, we look for more than x times
                        the cluster standard deviation. [default: 1.9]
  --xaxis COMPONENT     The component to use for the X axis. [default: C1]
  --yaxis COMPONENT     The component to use for the Y axis. [default: C2]

MDS Plot Options:
  --format FORMAT       The output file format (png, ps, pdf, or X11 formats
                        are available). [default: png]
  --title STRING        The title of the MDS plot. [default: C2 in function of
                        C1 - MDS]
  --xlabel STRING       The label of the X axis. [default: C1]
  --ylabel STRING       The label of the Y axis. [default: C2]

Scree Plot Options:
  --create-scree-plot   Computes Eigenvalues and creates a scree plot.
  --scree-plot-title TITLE
                        The main title of the scree plot [EIGENSOFT results]

Output File:
  --out FILE            The prefix of the output files. [default: ethnicity]
Input Files
This module uses PLINK’s binary file format (bed, bim and fam files)
for the source data set (the data of interest) and three sets of binary files
for the reference panels (CEU, YRI and JPG-CHB).
Procedure
Here are the steps performed by the module:
- Finds the overlapping markers between the three reference panels and the source panel.
- Extracts the required markers from all the data sets (source and reference panels).
- Combines the three reference panels together to create a single data set.
- Renames the reference panel’s markers so that they match the names of the markers in the source panel.
- Computes the frequency of all the markers from the reference and the source panels.
- Finds the markers to flip in the reference panel, to enable fast comparison with the source panel.
- Excludes markers that cannot be flip from the reference and the source panels.
- Flips the markers that need to be in the reference panel.
- Combines the reference and the source panels.
- Computes the IBS values (see Section Related Samples Module for more information).
- Creates the MDS file from the combined data set and the IBS values.
- Creates a population file for plotting purposes.
- Plots the MDS values.
- Finds the outliers of a given reference population (either CEU, YRI or
JPT-CHB).
- Reads the population file.
- Reads the MDS values.
- Computes the three reference population clusters’ center.
- Computes three clusters according to the reference population clusters’ centers, and finds the outliers of a given reference population.
- Writes the outliers in a file.
Output Files
The output files of each of the steps described above are as follow (note that
the output prefix shown is the one by default [i.e ethnicity]):
- Three files are created:
ethnicity.ref_snp_to_extract: a list of markers to extract from the reference panels.ethnicity.source_snp_to_extract: a list of markers to extract from the source panel.ethnicity.update_names: the updated names of the marker in the reference panels, so that they match with the names in the source panel.
- Four sets of PLINK’s binary files are created:
ethnicity.reference_panel.CEU: the data set containing the extracted markers from the CEU reference population.ethnicity.reference_panel.YRI: the data set containing the extracted markers from the YRI reference population.ethnicity.reference_panel.JPT-CHB: the data set containing the extracted markers from the JPG-CHB reference population.ethnicity.source_panel.ALL: the data set containing the extracted markers from the source population.
- One required file and one set of PLINK’s binary files are created:
ethnicity.reference_panel.ALL.files_to_merge: the file required by Plink to merge more than two data sets together.ethnicity.reference_panel.ALL: the data set containing the merged data sets of the three reference population.
- One set of PLINK’s binary files is created:
ethnicity.reference_panel.ALL.rename: the data set after markers have been renamed in the reference panels.
- Two sets of PLINK’s result files are created:
ethnicity.reference_panel.ALL.rename.frequency: the frequencies of the markers in the reference panels.ethnicity.source_panel.ALL.frequency: the frequencies of the markers in the source panels.
- Two files are created:
ethnicity.snp_to_flip_in_reference: the list of markers to flip in the reference panels.ethnicity.snp_to_remove: the list of markers to remove because they are not comparable to the markers in the source panel, even after trying to flip them.
- Two sets of PLINK’s binary files are created:
ethnicity.reference_panel.ALL.rename.cleaned: the data set after the markers found in the previous step are excluded from the reference panels.ethnicity.source_panel.ALL.cleaned: the data set after the markers found in the previous step are excluded from the source panel.
- One set of PLINK’s binary files is created:
ethnicity.reference_panel.ALL.rename.cleaned.flipped: the data set after markers from the reference panels were flipped so that they become comparable with the source panel.
- One required file and one set of PLINK’s binary files are created:
ethnicity.final_dataset_for_genome.files_to_merge: the file required by Plink to merge more than two data sets together.ethnicity.final_dataset_for_genome: the data set containing the merged reference and source panels.
- Multiple files are created after this step.
ethnicity.ibs: for more information about those files, see Section Related Samples Module.
- One set of PLINK’s result files is created:
ethnicity.mds: files containing the MDS values.
- One file is created:
ethnicity.population_file: the population file required for MDS value plotting.
- One file is created:
ethnicity.mds.png: the plot of the MDS values (see Figure Initial MDS plot).
- Four files are created:
ethnicity.before.png: the MDS values before outliers detection (see Figure MDS plot before outlier detection).ethnicity.after.png: the MDS values after outliers detection for each of the three reference populations. The shaded points are the outliers (see Figure MDS plot after outlier detection).ethnicity.outliers.png: the MDS values after outliers detection for the selected reference population (default is CEU) (see Figure Ethnic outliers).ethnicity.outliers: the list of outliers (excluding the reference populations).ethnicity.population_file_outliers: a population file containing the outliers (to help creating a new MDS plot usingpyGenClean.PlinkUtils.plot_MDS_standalone).
The Plots
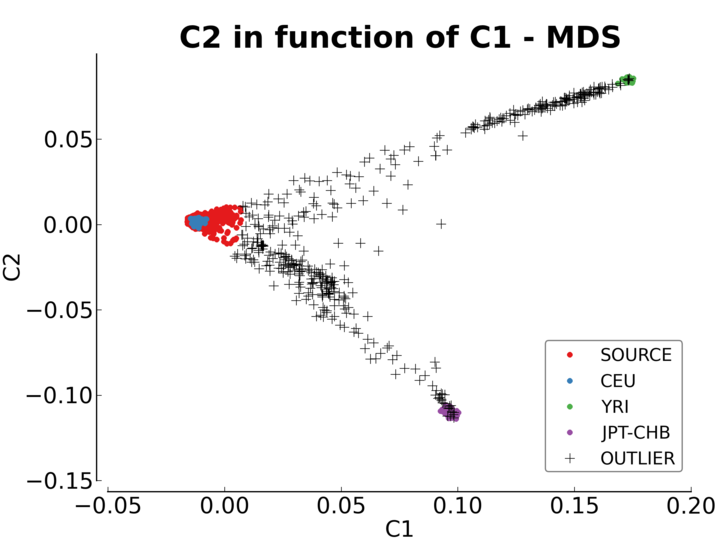
Multiple plots are created by this module. The first one (Figure Initial MDS plot) is the MDS values right after they are computed by Plink. There is one color per reference populations (CEU in blue, YRI in green and JPT-CHB in purple). The source population is represented as red crosses.
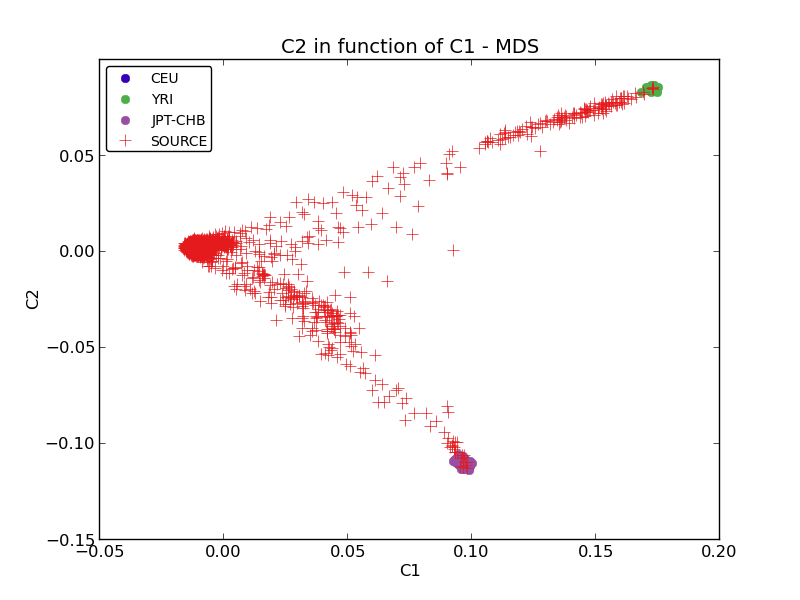
Initial MDS plot
The second one (Figure MDS plot before outlier detection) is the MDS values before outlier detection. Points in red, green and blue represent the individuals part of the CEU, YRI and JPT-CHB clusters, respectively. The yellow points represent the center of each of the cluster, when only considering the three reference panels.
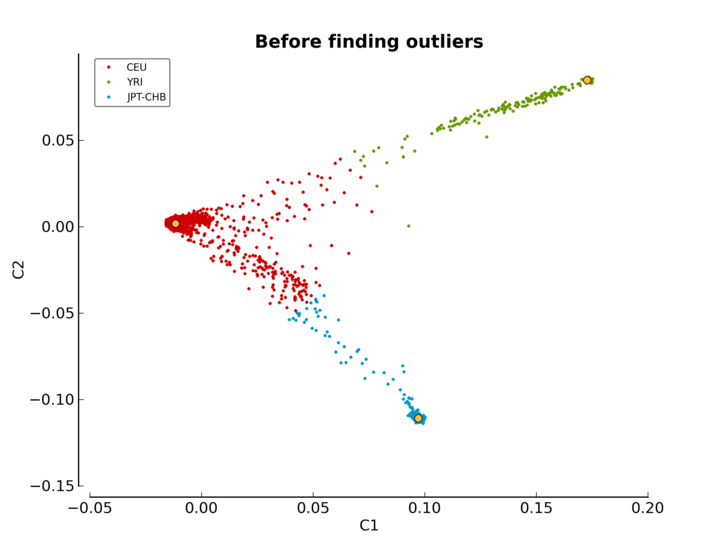
MDS plot before outlier detection
The third plot (Figure MDS plot after outlier detection) is the MDS values after outlier detection. Points in red, green and blue represent the individuals part of the CEU, YRI and JPT-CHB clusters, respectively. Outliers are found for each of the three reference populations and they are represented with the same, but lighter color. Once again, the yellow points represent the center of each of the cluster, when only considering the three reference panels.
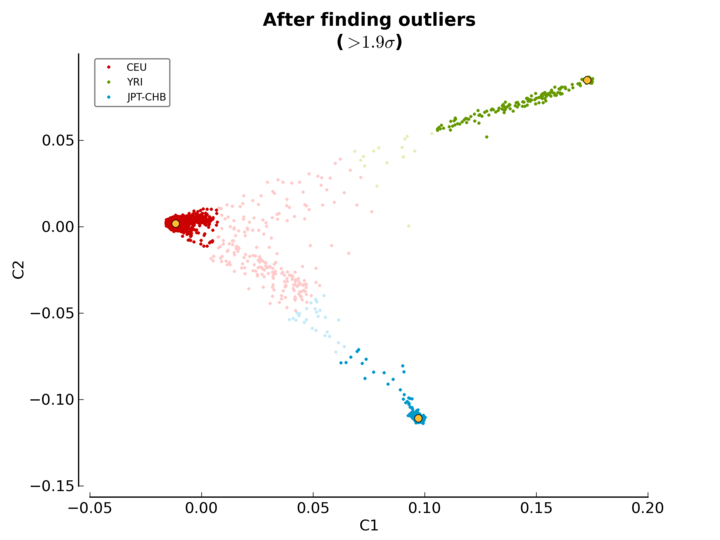
MDS plot after outlier detection
The last plot (Figure Ethnic outliers) shows the outliers of the selected reference population (CEU by default). Red, green and blue represent the CEU, YRI and JPT-CHB samples, respectively. Orange represents the individuals from the source panel who are part of the selected reference population. Gray represents the outliers of the selected reference population.
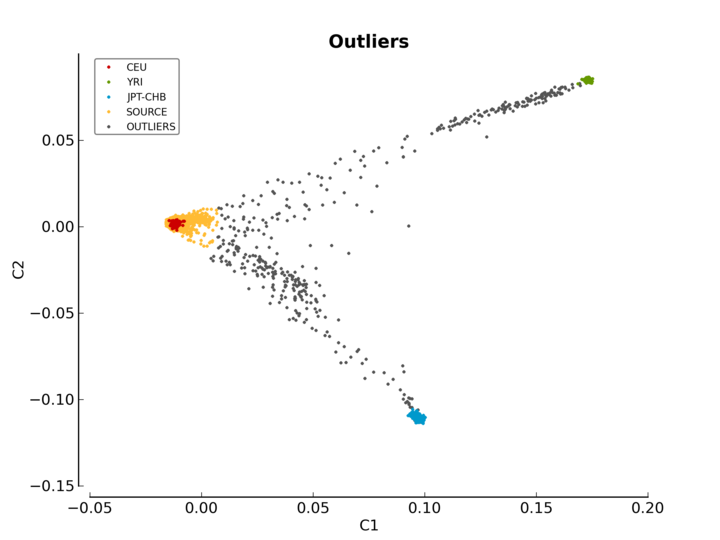
Ethnic outliers
Modifying The Outlier Plot
If you want to manually modify the above figures, have a look at the
pyGenClean.PlinkUtils.plot_MDS_standalone module. Here is the usage
of this script:
$ pyGenClean_plot_MDS --help
usage: pyGenClean_plot_MDS [-h] [-v] --file FILE --population-file FORMAT
                           [--population-order STRING]
                           [--population-colors STRING]
                           [--population-sizes STRING]
                           [--population-markers STRING]
                           [--population-alpha STRING] [--format FORMAT]
                           [--title STRING] [--xaxis STRING] [--xlabel STRING]
                           [--yaxis STRING] [--ylabel STRING]
                           [--legend-position STRING] [--legend-size INT]
                           [--legend-ncol INT] [--legend-alpha FLOAT]
                           [--title-fontsize INT] [--label-fontsize INT]
                           [--axis-fontsize INT] [--adjust-left FLOAT]
                           [--adjust-right FLOAT] [--adjust-top FLOAT]
                           [--adjust-bottom FLOAT] [--out FILE]

Creates a MDS plot.

optional arguments:
  -h, --help            show this help message and exit
  -v, --version         show program's version number and exit

Input File:
  --file FILE           The MBS file.
  --population-file FORMAT
                        A file containing population information. There must
                        be three columns: famID, indID and population
                        information.

Population Properties:
  --population-order STRING
                        The order to print the different populations.
                        [default: CEU,YRI,JPT-CHB,SOURCE,OUTLIER]
  --population-colors STRING
                        The population point color in the plot [default:
                        377eb8,4daf4a,984ea3,e41a1c,ff7f00]
  --population-sizes STRING
                        The population point size in the plot. [default:
                        12,12,12,8,3]
  --population-markers STRING
                        The population point marker in the plot. [default:
                        .,.,.,+,D]
  --population-alpha STRING
                        The population alpha value in the plot. [default:
                        1.0,1.0,1.0,1.0,1.0]

Graphical Properties:
  --format FORMAT       The output file format (png, ps, pdf, or X11 formats
                        are available). [default: png]
  --title STRING        The title of the MDS plot. [default: C2 in function of
                        C1 - MDS]
  --xaxis STRING        The component to print on the X axis. [default: C1]
  --xlabel STRING       The label of the X axis. [default: C1]
  --yaxis STRING        The component to print on the Y axis. [default: C2]
  --ylabel STRING       The label of the Y axis. [default: C2]
  --legend-position STRING
                        The position of the legend. [default: best]
  --legend-size INT     The size of the legend. [default: 10]
  --legend-ncol INT     The number of column for the legend. [default: 1]
  --legend-alpha FLOAT  The alpha value of the legend frame. [default: 1.0]
  --title-fontsize INT  The font size of the title. [default: 15]
  --label-fontsize INT  The font size of the X and Y labels. [default: 12]
  --axis-fontsize INT   The font size of the X and Y axis. [Default: 12]
  --adjust-left FLOAT   Adjust the left margin. [Default: 0.12]
  --adjust-right FLOAT  Adjust the right margin. [Default: 0.90]
  --adjust-top FLOAT    Adjust the top margin. [Default: 0.90]
  --adjust-bottom FLOAT
                        Adjust the bottom margin. [Default: 0.10]

Output File:
  --out FILE            The prefix of the output files. [default: mds]
And here is an example of usage (for a MDS and a population file named
ethnicity.mds.mds and ethnicity.population_file_outliers, respectively),
producing the Figure Ethnic outliers modified.
$ pyGenClean_plot_MDS \
>     --file ethnicity.mds.mds \
>     --population-file ethnicity.population_file_outliers \
>     --population-order SOURCE,CEU,YRI,JPT-CHB,OUTLIER \
>     --population-colors e41a1c,377eb8,4daf4a,984ea3,000000 \
>     --population-markers .,.,.,.,+ \
>     --population-sizes 8,8,8,8,8 \
>     --axis-fontsize 18 \
>     --label-fontsize 18 \
>     --title-fontsize 24 \
>     --adjust-bottom 0.11 \
>     --adjust-left 0.15 \
>     --adjust-right 0.96 \
>     --legend-size 14 \
>     --legend-position lower-right
Ethnic outliers modified
Finding Outliers
If the multiplier of the cluster standard deviation was too stringent (or not
stringent enough), there is no need to run the module from the start. A
standalone script was created for this exact purpose, and it will find the
outliers using the MDS and population file previously created. Just modify
the --multiplier option and restart the analysis (which takes about a couple
of seconds).
$ pyGenClean_find_outliers --help
usage: pyGenClean_find_outliers [-h] [-v] --mds FILE --population-file FILE
                                [--outliers-of POP] [--multiplier FLOAT]
                                [--xaxis COMPONENT] [--yaxis COMPONENT]
                                [--format FORMAT] [--out FILE]

Finds outliers in SOURCE from CEU samples.

optional arguments:
  -h, --help            show this help message and exit
  -v, --version         show program's version number and exit

Input File:
  --mds FILE            The MDS file from Plink
  --population-file FILE
                        A population file containing the following columns
                        (without a header): FID, IID and POP. POP should be
                        one of 'CEU', 'JPT-CHB', 'YRI' and SOURCE.

Options:
  --outliers-of POP     Finds the outliers of this population. [default: CEU]
  --multiplier FLOAT    To find the outliers, we look for more than x times
                        the cluster standard deviation. [default: 1.9]
  --xaxis COMPONENT     The component to use for the X axis. [default: C1]
  --yaxis COMPONENT     The component to use for the Y axis. [default: C2]
  --format FORMAT       The output file format (png, ps, or pdf formats are
                        available). [default: png]

Output File:
  --out FILE            The prefix of the output files. [default: ethnicity]
The Algorithm
For more information about the actual algorithms and source codes, refer to the following pages.